In a SQL world, query optimizers are well matured and understood, distributed systems on other hand are new and not very mature. Understanding how the queries work is very important.
Some of our Elasticsearch queries started taking more than 100 seconds causing various timeouts, garbage collections, cache evictions etc. This blog post lists various interesting things we found out in our analysis and how we optimized most of our queries to under a sub second and lessons learnt along the way.We used Marvel to dig in to the elasticsearch metrics to pinpoint the root cause.
At the time of slowness, we were seeing about 150K requests per second.

Number of search requests itself is not a problem. The graph below shows the size of the filter cache. We currently have 11 Elasticsearch nodes in production with 30GB of memory for each instance for a total of 330GB of memory for the entire cluster. Of that 330GB of memory about 40% of it is dedicated to the filter cache. When we query an index the results of each request is cached here and can be reused for future requests greatly improving query performance.

This memory space is shared by all customers in production and is managed by a least recently used schedule. When we fill up the filter cache space the least recently used filters are evicted.
We can see from the above graph the thrashing of memory space where we are constantly building up and evicting filters over and over again for a continuous time period. This led to some very long garbage collections.
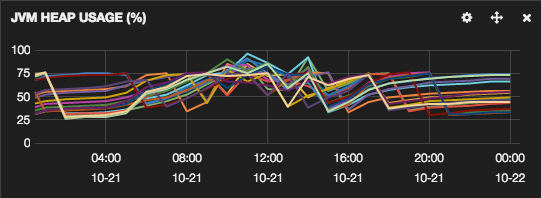
 All the evictions are causing lots of old generation garbage collection cycles. The old GC’s is that they can have a stop the world phase. That means that for the duration of the garbage collection that Elasticsearch node is dead to the rest of the cluster. It will not respond to requests or cluster pings. Ideally Old GC’s should be rare and short lived. What we are seeing here are frequent and long lived GC’s for many nodes.
The long lived garbage collection cycles that took over 5 seconds each. The node could stop responding five seconds a time four times over the course of 2 mins requests. Which is the root cause for our 100sec query times.
Our CPU usage or disk i/o on the other hand is not stressed. We are mostly memory bound. Nodes in our cluster have 64GB of memory, 30GB of which is allocated to elasticsearch JVM and remaining is allocated to file cache. We have seen that due to the file cache and SSD’s, 132GB of filter cache is being filled up in less than 4 seconds causing out of memory exceptions which it turn crashing the cluster.
1 : UPGRADE MEMORY
Upgrading hardware is not always a solution, but in our case since we are mostly memory bound we could just double the ram on the nodes. But its not recommended to allocate more than 32GB for JVM heap. So we decided to double our RAM and run two instances of Elasticsearch on each node, thanks to Elasticsearch rack awareness both primary and replica shards doesn’t live on the same box. Upgrading the ram bought us time to figure out what’s going on.
2 : CONTROL WHAT’S BEING CACHED
Our first intuition is look at what we cache. When we looked at our queries we realized that we cache almost everything which is a lot, when we have thousands of queries per second. For example one of our queries look something like this
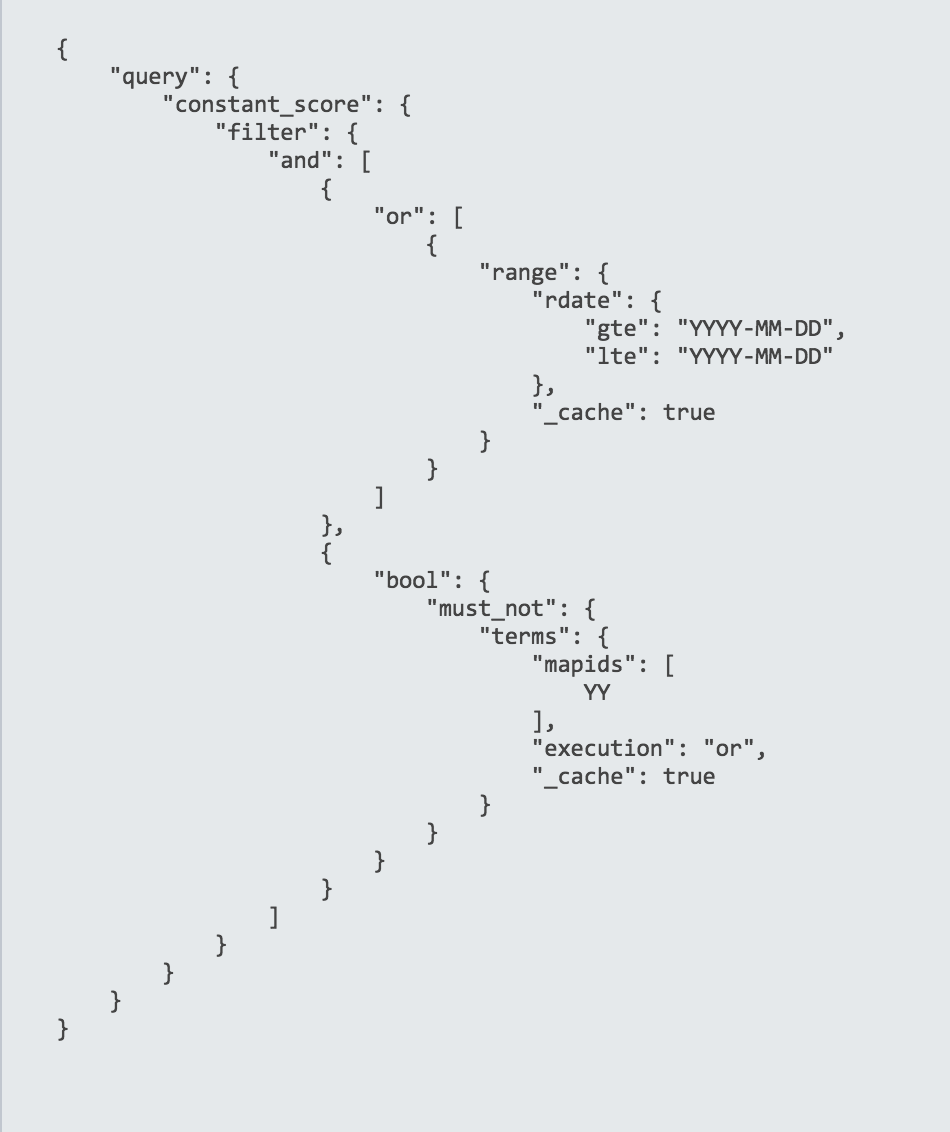
We tried caching only some filters while avoiding others, which did help but as much as we expected.
3 : CHANGE THE QUERIES
At the time of slowness, we had about 64 billion documents in the cluster. Requests are executed in a map reduce fashion. Requests from the client are load balanced and distributed across all the nodes in the cluster. The node receiving the request sends the request to all the nodes containing the shards. Each shard caches the filter using bit sets.

Since the filters are cached on the first requests, all the subsequents requests should be served from memory. But the problem, the request can be routed to both primary and replica and due to large number of requests, the filter cache is continuously teared up and rebuilt. In effort to decrease the number of queries we started looking in to aggregations.
4 : AGGREGATIONS
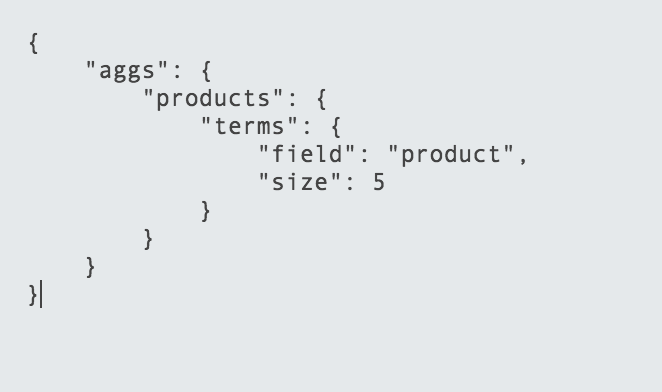
There are lots of aggregations supported by Elasticsearch. For example, terms aggregation query shown above is very similar SQL group by. But in Elasticsearch the data is distributed among multiple shards. So when an aggregation query is executed, the request is sent to all the shards and shards reply with their view of data. The node collecting the result does the aggregation and sends them back to the client. Due to the distributed nature there are not always accurate. Elasticsearch has some documentation on how this works
Once the data is bucketed by a key, Elasticsearch support nested aggregations like

In the above query, the documents are first grouped by their gender and their average height for each bucket is being calculated. All of this can be done using just one query and its executed parallel across several nodes in your cluster. Causing the number of queries go down and in turn decreasing the stress on memory.
But to use aggregations all the field data has to be loaded in to memory. Elasticsearch stores the field data in to field cache, which is by default 10% of JVM heap. Which raises more concerns as it has to load all the field data in to memory mostly likely causing out of memory exceptions since we cannot predict the amount of memory that we would need. Which might lead to more stress on memory, leading to more old generation garbage collections leading to slow query times and even the risk of crashing the cluster.
To avoid this, Elasticsearch has circuit breakers to safe guard the amount of memory being used by the field cache. Which can also be set at a request level, when a request is consuming more memory than a certain level, the requested is terminated. And we are trading more CPU for RAM. By default, field data is lazy loaded, but there are various workarounds in the Elasticsearch documentation. There are also plans to use file system cache for field data. File System Cache is managed by the OS and is much more efficient and no garbage collections. Distributed systems are slowly moving away from using JVM heap. Apache Kafka now completely depends on file system cache.
http://www.elasticsearch.org/guide/en/elasticsearch/guide/current/preload-fielddata.html
Also sometimes, aggregations can be 10X slower than regular queries. For example, when using the terms aggregation query if the number of keys are less than 25, querying each key individually is much faster than an aggregate query. Bottom line, JVM heap can be a blessing and a curse. Memory is the one of reasons why elasticsearch is so fast but if not careful it might drastically affect the performance. Doesn’t necessarily mean to not use memory but to decrease the stress of JVM heap and use file system cache or similar.
If you have any questions, please leave a comment below or reach me out at abhishek376@gmail.com / @abhishek376

Thanks for sharing your thoughts.
Thanks for the post, it really helps.
Well written; thank you! One question, what was the solution for aggregates – was it to use buckets?
Yes. In es 2.0 doc values are enabled by default and aggs are way faster.
I am using ES 1.5. I have problem with aggregations, each of my indices have around ~100 million documents with 5 primary shards and 1 replica for each.
The problem is that as the load increases a simple term aggregation on 157 records takes around 60s, which is a lot. I am reducing the set on which aggregate works from 100 mil to 157 records by using a filter aggregation. Have you guys run across this issue?
Its probably too late but look in to doc values. In es 2.0 doc values are enabled by default.
Hey Abhishek,
Had doubts regarding the bool filter clause, Here’s what we follow
*Filter all the data that one could in the must clause and leave little to the or/should clauses to filter*, following this we seem to be running into a bool filter inside the must clause, is this is good approach?
Any suggestions as to how simple we should keep the clauses?
great post, thanks for sharing.
Would you please the details such as event logs, index size etc., ?
that would help
Your name overly complicated. So, I shall call you- Ab And.